
From -6 to 5,859: The 2018 Philadelphia Eagles by the Numbers
When the Eagles fell to 6-7 after that crappy Dallas loss, did you think we’d be talking about a playoff game three weeks later?
Yeah, me neither.
Yet here we are on January 2nd, now four days away from a winnable postseason trip to Chicago. Funny how things change so quickly in the National Football League.
We’ll get into the Bears later today and tomorrow, but let’s first put a wrap on the regular season with a trip down statistics lane. What do the numbers tell us about the Birds’ campaign? It was a title defense year that featured more ups, downs, and nauseating moments than that rickety old wooden rollercoaster at Dorney Park. Hercules, I think it was called.
5,859
Total yards allowed. It was the 10th-worst number in the NFL.
5,845
Total yards gained. The Eagles finished 14th in the league, right around the middle of the pack.
4,308
Passing yards allowed. They were the 30th team in this department, which is certainly due to secondary issues and errors and injuries, but also takes into account how good the Eagles were against the run, which forced teams to abandon the ground game and chuck it instead.
4,275
Passing yards gained. They were 7th in the NFL.
1,570
Rushing yards gained. 28th out of 32 teams here, ahead of only Tampa, Minnesota, Pittsburgh, and Arizona. The injuries to Darren Sproles, Jay Ajayi, and Corey Clement really killed the Eagles’ ability to run the ball. The departure of LeGarrette Blount also didn’t help.
1,551
Rushing yards allowed. They finished top-seven for the second straight season, slightly down from last year but still incredibly stout.
1,163
Receiving yards for Zach Ertz, a career high and the 16th best number in the NFL.
1,039
Malcolm Jenkin’s defensive snaps:
Malcolm Jenkins played all 1,039 defensive snaps for the #Eagles in the regular season.
That means he’s played 5,579 of 5,669 (98.4%) defensive snaps since joining the team in 2014.
Incredible.
— Dave Zangaro (@DZangaroNBCS) January 1, 2019
Jenkins played every single defensive snap and also about 25% of the special teams snaps as well. It’s incredible stuff.
1,037
Scrimmage plays. The Eagles finished top-10 in total plays run on the strength of their excellent time of possession numbers.
852
Yards penalized. The Birds were a top-10 team in avoiding flags. Andy Reid’s Chiefs finished with the worst mark, so they’ve “got to do a better job.”
676
Shotgun plays, which comprised 60% of the Eagles’ offensive sets this season. They ran 30% of their offense from under center while various other formations (punts, no huddle) make up the rest.
511
Rushing yards for rookie Josh Adams, who led the Eagles in this category but finished 41st in the NFL.
477
This was the Eagles’ “experience” score on the offensive line. Defined as “the combined career starts for the two guards, two tackles and center on team with the most starts in the current season,” the Birds had the second highest number in the league. Continuity on the offensive line wins football games, and they played really well down the stretch.
367
Total points, 18th in the NFL.
365.3
Offensive yards per game. 14th.
364
A career high in rushing yards for Wendell Smallwood, who also had a career-high 22 first downs, a 4.2 yards per rush number, and three touchdowns. He entered camp as the fourth runner on the roster.
363
Yards after the catch for Zach Ertz. He led the Eagles in YAC but was only 34th in the NFL.
348
Points allowed, which is 21.8 per game. That was good for 12th-best.
346
First downs. They finished 11th here on the strength of some really well-executed long drives.
332
Opponent rushing attempts. The Eagles and Bears (339) finished #1 and #2 in the NFL this category, as teams completely abandoned the run game against their solid defensive fronts. I’d imagine we won’t see many rushing attempts from either team on Sunday.
283
Nick Foles’ passing yards per game, 8th in the NFL.
267.2
Team passing yards per game. 7th.
249
Yards lost from sacks. This was a middle of the road number and the Eagles did a serviceable job here.
221
First downs via pass, 7th in the NFL.
194
Opponent punt return yards. The Eagles were a top-half team in limiting other teams in this area. It was one of special teams areas where they really excelled.
156
Targets for Zach Ertz, which was 6th most in the NFL, behind only Julio Jones, Davante Adams, Antonio Brown, DeAndre Hopkins, and JuJu Smith-Schuster.
116
Receptions for Zach Ertz, an NFL tight-end record and second in the league this season behind only Michael Thomas.
111
Points scored for Jake Elliott, the Eagles’ leader.
103
Punt return yards for team leader DeAndre Carter, who was waived and ended up signing with the Texans.
102.2
Carson Wentz’s quarterback rating, which was 7th best in the NFL. Nick Foles finished at 96.0 but didn’t play enough snaps to qualify as a starting QB.
102
Quarterback hits allowed, 11th best in the NFL. The line did a pretty good job of keeping their guys protected, especially down the stretch.
100.8
Wentz, Foles, and Nate Sudfeld’s combined QB rating, which was also 7th best overall. Nelson Agholor was the only other player to throw a pass this year.
100
Penalties. The Eagles actually showed a lot of discipline this year. Only eight other teams took fewer penalties.
99
Fourth quarter points. The Eagles scored more points in the final 15 minutes than any other quarter of the game. They were notoriously slow starters during the middle portion of the season.
98.1
Rushing yards per game, which is poor. They were one of just six teams to average fewer than 100 rushing yards per game.
94.3
Elliott’s extra point conversion rate. He was 33-35 this season.
94
Rushing first downs. 18th overall.
83.9
Jake Elliott’s field goal percentage. He hit 26 of 31 attempts to finish 21st among place kickers.
83
The longest yardage on a complete pass this season. It was Nelson Agholor’s touchdown against the Texans two weeks ago. Only four other players in the NFL had longer receptions this year.
79
Solo tackles for Malcolm Jenkins, who led the team. He had 18 assists to finish tied with Nigel Bradham with 97 combined tackles.
75
Dallas Goedert’s catch percentage, which was 7th-best in the NFL and also led the Eagles. He caught 33 of 44 balls thrown his way, just edging out Ertz, who finished with a 74.36 catch percentage,
72.3
Foles’ completion percentage, which was a career high.
69.6
Wentz’s completion percentage. It was also a career-high and the third best mark in the league among qualified quarterbacks. (Nick only threw 195 passes this year)
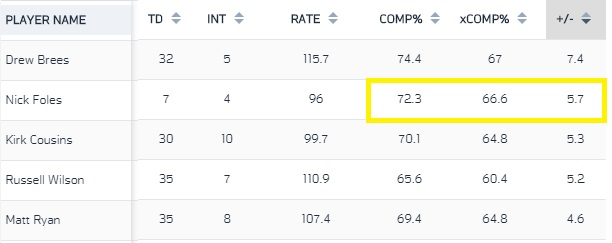
66.6
Nick Foles’ xCOMP%, which stands for expected completions.
The NFL analytics nerds use a formula that involves receiver separation from the nearest defender, where the receiver is on the field, the separation the passer had at time of throw from the nearest pass rusher, and other advanced stats. Nick was only expected to complete two-thirds of his passes, but finished with a 72.3 number instead, which means only Drew Brees out-performed expectations at a higher rate this season:
66
First down receptions for Ertz, the 8th-best number in the NFL.
60.9
Fourth down conversion percentage. Aggressive Doug Pederson resulted in the Eagles finishing 10th in the NFL here.
57.9
Opponent fourth downs converted. They allowed teams to go 11-19 on 4th down, and some of those plays in the Tennessee game were excruciatingly backbreaking.
57.9
Red zone conversion rate, 17th in the league.
57
Total trips to the red zone. 10th overall.
56
Elliott’s longest field goal this season. He was 2-5 in attempts of 50+ yards.
55.6
The longest completed air distance on any throw this season. Foles’ touchdown to Agholor traveled more than half the distance of the field before “Nelly” did the rest with his feet.
48.1
Cameron Johnston’s average punt yardage, third best in the NFL.
44
Eagle sacks, tied for eighth-best in the league.
42.7
Johnston’s net punt yardage, fourth best in the NFL.
41
Third down conversion percentage. They were 12th in the NFL in moving the sticks on third down.
41
Touchdowns, 17th best in the NFL. They scored 29 through the air and only 12 on the ground.
40
Sacks allowed. Middle of the pack here.
37.4
Pass attempts per game, 7th overall.
35.3
Opponent third down percentage. The Eagles actually finished 6th in this area, so they did a nice job at getting off the field in these situations. They just had trouble limiting first down and second down chunk gains earlier in the season and some of those fourth down plays that I mentioned above were killers.
33
Red zone touchdowns. 12th best.
32:39
Average time of possession per game. The Birds were second best in the NFL at controlling the ball and keeping their offense on the field.
32
Yardage of the Eagles’ longest run. Only Pittsburgh and Tampa had less-explosive running games.
32
Field goals allowed. This was fourth-most in the league, which technically is a very good thing, because it shows that you are more or less “bending but not breaking.” More nuance is needed for this statistic, but when you combine it with the fact that the Eagles finished mid-pack in total touchdowns allowed, it suggests that they did a good job with red zone and goal line defense.
31
First downs via opponent penalty. They finished right in the middle here, so the intangible nature of this stat didn’t weigh too heavily on their success or lack thereof.
29
Passing touchdowns. 11th.
28
The Eagles began their drives on average at their own 28 yard line, which was the 16th-best starting point league-wide.
25.6
Yards per kick return for Corey Clement, who led the Eagles.
24.9
Rush attempts per game, 20th.
23
Fourth down attempts, second in the NFL behind only Denver. That’s “big balls Doug” staying aggressive, which also contributed to the time of possession number.
22.9
Points per game. 18th.
22
Passing touchdowns allowed. This was a top-ten positive number, despite the Eagles finishing 30th in total passing yards allowed. This too suggests that they did a nice job at holding opponents to field goals despite seemingly being gashed between the twenty yard lines in pass defense.
22
Yards per kickoff return from all Eagle players. Another bottom-half performance here. The Birds really were very average in the return game.
22
First downs allowed via penalty. This was a top-five number and the Eagles really did a nice job of limiting cheap plays to give opponents a new set of downs. There were few offside jumps and roughing the passer plays and similar avoidable whistles.
21.6
First downs per game, 11th best.
20
Negative rushing yards to the left side of the formation. Compare this to only 5 negative run plays going behind Brandon Brooks and Lane Johnson. The Eagles just seemed to feast or famine on running behind the left guard and left tackle, whether it was Jason Peters, Big V, Isaac Seumalo, or Stefen Wisniewski.
19.2
First downs allowed per game. They finished eighth-best here and did a nice job at getting off the field, which may not seem obvious considering some of the blown 4th quarter plays we witnessed earlier in the year.
14
Rushing touchdowns allowed, 19th overall.
13
Alshon Jeffery’s yards per reception, which led the Eagles but was 45th in the league. The Eagles did not consistently complete passes down the field in 2018.
12
Rushing touchdowns. Bottom-half figure.
12
Forced fumbles, bottom-third.
12
Ronald Darby’s team-high pass break-ups.
11
Interceptions thrown. Wentz and Foles combined to throw the 10th-fewest picks in 2018.
11
Fair catches. This was the second-lowest number in the league. They returned more than 75% of opponent punts, but only for bottom-half yardage results.
10.5
Sacks for Fletcher Cox, a career high. He did this while receiving a lot of double teams from opposing linemen.
10
Interceptions, which was in the bottom-third of the league.
8
Receiving touchdowns for Zach Ertz, tied for 13th league-wide.
7.67
Carson’s yards-per-attempt. It was 9th best in the NFL and higher than Aaron Rodgers, Ben Roethlisberger, and Andrew Luck.
7.4
Yards allowed per pass. This was middle of the road, so the Eagles weren’t continually getting torched down the field, but opponents were picking up NFL average gains.
7
Fumble recoveries.
6.1
Average plays per drive, 5th best and another indicator of TOP prowess.
5.8
Average completed air yards for Carson Wentz, which was in the bottom half of starting quarterbacks. Nick’s number was 4.6, so he was completing passes at shorter distances than Carson on average. This is typical considering the type of offense they run.
5.6
Yards per play, 15th overall as a west coast shotgun team.
5
Receiver fumbles. The Birds coughed it up nearly a half dozen times after the catch, but only lost one of those fumbles.
4.7
Opponent yards per rush. This was not a great number for the Eagles, but it was certainly bloated by the Adrian Peterson 90-yard touchdown run. They were able to keep the raw number down because of the last three games, where they were able to take early leads and force teams to throw.
3
Malcolm Jenkins’ forced fumbles. He finished 11th in the league.
3
Rasul Douglas interceptions. He led the Eagles in picks.
2:58
Average time per drive, third best in the NFL to complement that second-best TOP number.
0
Return touchdowns this season. The Eagles didn’t return a punt, kickoff, interception, or fumble for a score.
0
Punts blocked. Johnston got everything off clean.
-6
Turnover margin. The Eagles made the playoffs despite being the 25th worst team here. They were the lowest ranked giveaway/takeaway team to qualify for the postseason. The teams below the Birds were Oakland (-7), Jets (-10), Steelers (-11), Cardinals and Jags (-12), Bucs (-18), and Niners (-25).
Conclusions:
The Eagles didn’t run the ball very well, but they were a top-ten passing team and did a really nice job of controlling the clock and moving the chains on third and fourth down. Both quarterbacks had career-high completion percentages as they rode Zach Ertz up and down the field. Doug’s aggressive play calling was the difference in a lot of tight scenarios.
Defensively, they forced teams to pass, and while they gave up huge chunks of yardage in that department, they did a relatively decent job of buckling down in the red zone. In recent games, the line’s ability to generate a pass rush out of the base 4-3 look has really helped the injured secondary tighten up on the back end.
Both units committed few penalties and remained relatively disciplined, which helped offset a negative turnover margin. The defense did not take the ball away very much this year, and the offense suffered some brutal red zone interceptions and fumbles, but those trends were less like peaks and valleys and more like expected blips.
And the special teams units were steady, if unspectacular. Elliott hit some key field goals, but missed a couple of gimmes. Johnston had a quietly excellent season punting the ball while the return game was more or less average.
Stats courtesy of ESPN, NFL, NFL NextGen, Pro Football Reference, and NFL Savant.