
Ad Disclosure
Testing Our Surging Flyers Theory
By Jim Adair
Published:

Yesterday, I wrote about how the Flyers are in good shape going into the playoffs based on their points and goal differential over the last 25 games. A commenter suggested I look at the last few years to see if those stats are actual predictors of success. So I got all John Nash on this shit:
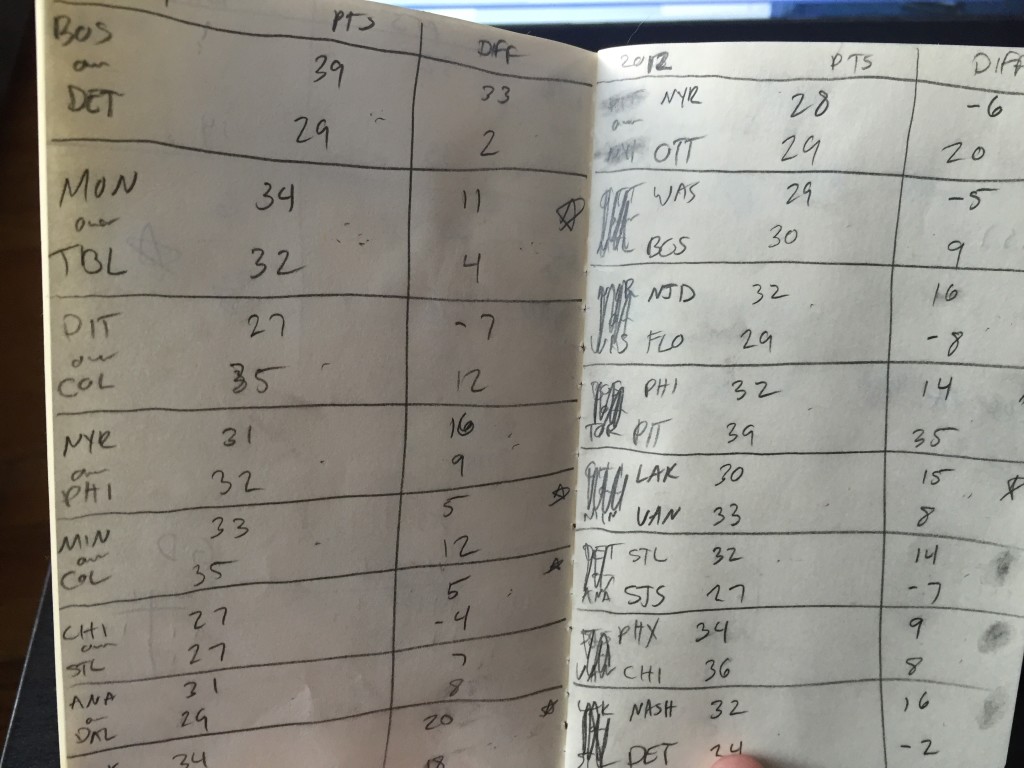
As it turns out, those numbers (goal differential especially) are pretty good indicators of a team’s likelihood to win their first round match-up, regardless of seed. Last year, the teams with more points over the last 25 games won five of the eight first-round playoff series’. The number was the same for teams with the better point differential. In series’ where the lower seeded team won, two of the three winners had more points and a higher goal differential over the last 25 games of the season.
But that’s just 2015. What about over the last five years?
It all comes down to goal differential. In the past five playoffs (not counting the lockout shortened 2013 season), the team with the better goal differential – regardless of seed – won their first round series 25 of 40 times. That’s a winning percentage of .625. Additionally, in the series’ where the lower seeded team won, the winner had a better goal differential 10 of 17 times (.588).
Goal differential over the final 25 games is actually a better predictor of a series win than seed alone. The better seeded team won 57.5% of the time, while the team with a better GD won 62.5%. I’ll take those odds.
So, yes, the Flyers having a +12 goal advantage over the Caps over the last 25 games is actually a indicator of a potential first round upset.

When he's not writing about sports here or ranting about them on Twitter, Jim is probably watching X-Files on Netflix or drinking a beer somewhere. Jim has nothing against hockey, it's just not his style. He once met Duce Staley at a Sixers game.