Ad Disclosure
Tuesday Data Dive: Eagles Offense Currently Lighting it Up, Even with Sluggish Second Halves

Welcome to our second installment of the Data Dive series. I forgot to do it last week, so I apologize for that.
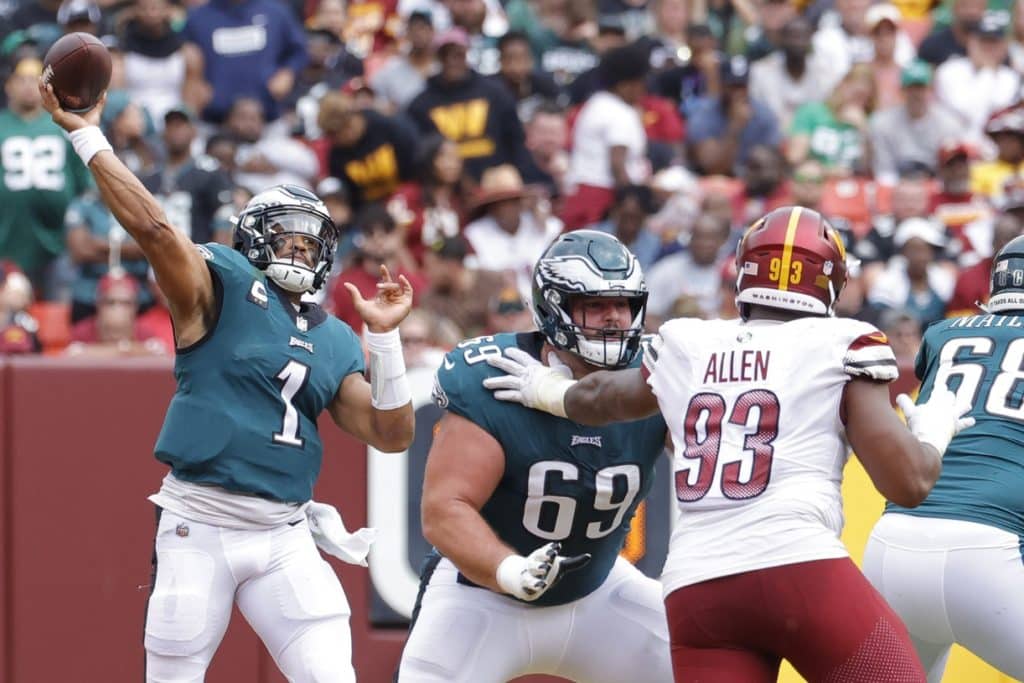
Anyway, we’re three weeks in and your Philadelphia Eagles are the lone unbeaten team in the NFC. They put it on the Commanders Sunday afternoon after walloping Minnesota in week 2, and most of the fan and media discussions seems to center around the efficiency we’ve seen out of the offense. That’s our focus as we look through the Sport Radar data and pick out some key metrics, with league-wide rankings in parentheses.
Your Birds offense:
- 345 yards after contact (#1)
- 433 yards after the catch (#5)
- 8.1 yards per touch (#6)
- 48.9% third down conversion rate (#2)
- 67 first downs (tied for 2nd)
- 86 total points (#5)
- 69.3 plays per game (7th)
- four 4th down conversions (tied for 3rd, *they’ve gone for it six times on 4th down, so they’re 66% on these plays)
- 51.9 successful play percentage (#8 overall, defined as any play that goes for a first down, touchdown, or gets you 40% closer to moving the chains)
- 15 plays of 20+ yards (tied for #1)
- 5 plays of 40+ yards (tied for #1)
- 2 plays of 50+ yards (tied for second with a lot of teams)
- 218 offensive snaps (6th)
- RPO percentage of 24 (#1)
- 31:38 time of possession per game (tied for 10th)
- 13.9 yards per reception (#1)
- 2.3 sacks allowed per game (middle of the pack)
- 447 yards per game (#1)
- 1 turnover (tied for lowest number in league)
- 10 touchdown drives (tied for fourth)
- 12 pass completions of 20+ yards (tied for 2nd)
- 100% on conversions (they have not attempted a two-point conversion yet, so this means Jake Elliott is 11 for 11 on extra points)
That’s a lot to digest, and obviously plenty of context can be applied here. For example, sometimes they gash teams so easily that they aren’t going to have a top-eight or top-five time of possession, because they’re easily into the end zone and kicking off again. You’ve also got a dual threat running QB back there, so sack numbers will look different than they might for a typical pocket passer.
What stands out to me when looking through that data though is explosiveness. 15 plays of 20+ yards through three games is beautiful. They have tons of yards after contact and after receptions, so they are ripping off chunk plays with relative ease. Add in the fact that they protect the ball and only have one turnover (on a mistimed screen play), and that’s a recipe for success.
One of the few negatives that people bring up is the lack of second half offensive output. Here’s what I was able to find to add some nuance to the “they need to play better in the 3rd and 4th quarter” take:
- +51 first half point differential (#1 by a large margin)
- -15 second half differential (26th worst)
- 72 first half points scored (#1 in league)
- 14 second half points (5th worst)
- 17:22 first half time of possession (2nd)
- 14:15 second half time of possession (19th)
There could be a variety of reasons for this. They’ve obviously been playing with leads, so they can afford to slow it down a bit, run the ball, and control the clock. Maybe they limit the playbook in the second half. The Birds’ D starts to tire, perhaps. They aren’t controlling as much of the clock, as you see in the 1h/2h time of possession disparity there.
Consider this as well:
I feel like the Vikings game also had some bizarre circumstances in the 3rd (blocked FG, penalties, etc.). Think they have also moved the ball fairly well in the 2nd half of 2/3 games. Small sample.
— Mark Paul (@mryanjr87) September 27, 2022
Sample size is tough in the NFL. There just aren’t many games to begin with. Prior to the 17-game schedule, you’d finish week 4 and be done with 25% of the season, which is pretty crazy to think about. In this case, the Eagles have played 17.6% of the season heading into the Jacksonville game.
Kevin has been writing about Philadelphia sports since 2009. He spent seven years in the CBS 3 sports department and started with the Union during the team's 2010 inaugural season. He went to the academic powerhouses of Boyertown High School and West Virginia University. email - k.kinkead@sportradar.com